This demonstration shows an example of information fusion where the interpretation of information requires the integration of dynamically changing, non-linear variables. This example includes control variables that can "bend the curves" or provide a way for external variables to change how the information is to be interpreted.
For this demonstration the SME (Subject Matter Expert) / domain expert needs a policy that can interpret information from collected data and provide advice in terms of an automatic threat warning system. Furthermore, we've added tuning parameters for the user.
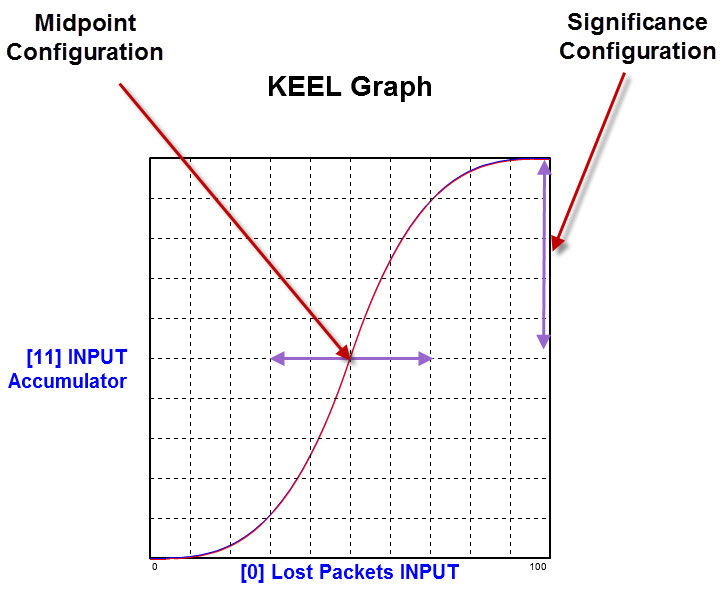
Three factors are being interpreted: Lost Packets, Latency, and Available Bandwidth. Each factor can be configured for its significance in determining the overall threat level. Also, the midpoint or shape of the curve can be configured for each factor. For this design, the midpoint could be automatically adjusted based on global / political conditions, and thereby provide an automatic sensitivity adjustment.
The graph below shows how modifying the shape of the S-Curve can be manually or automatically configured.
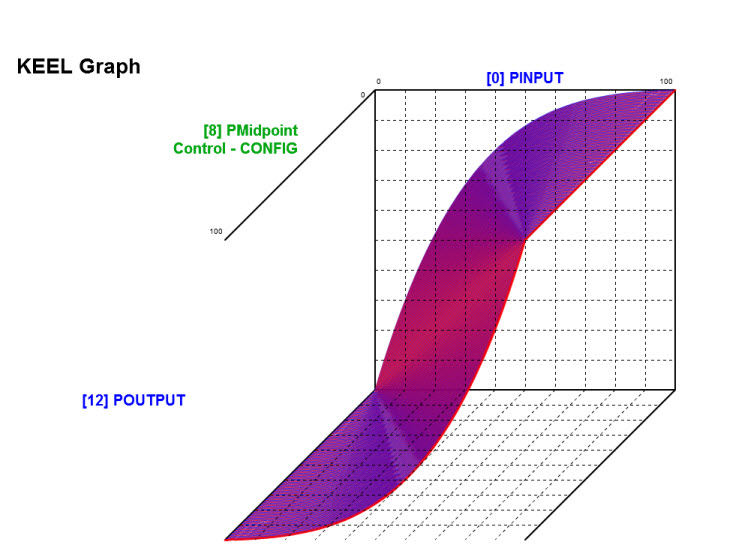
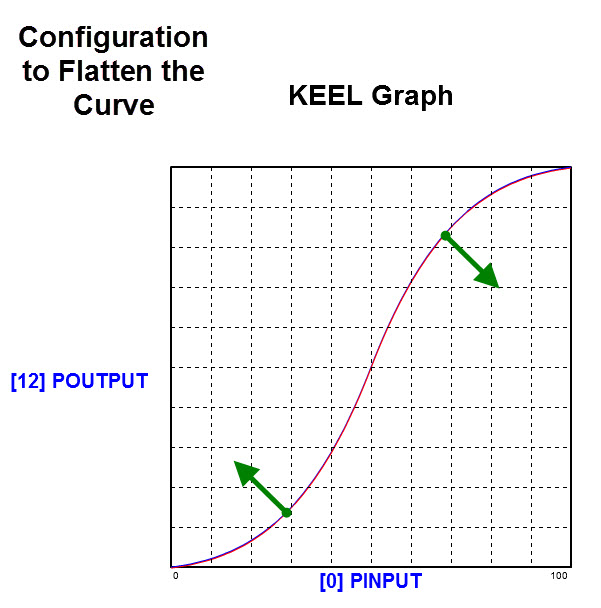
Another configuration parameter is included in the design (but not exposed to the user) supports configuring the "shape" of the S-curve (from linear to more drastic curve).
This demonstration is intended to show another example of how a human expert might mentally integrate several variables in order to accumulate a weighted response.
The graphs were all created with the KEEL "tools" in order to help visualize the impacts of various tuning parameters during the design process.
The interactive demonstration at the top of this webpage is an Adobe Flash application embedded in this web page. The information is processed in a KEEL Engine created by the KEEL Toolkit and deployed as Flash Actionscript. The Actionscript "code" was automatically generated by the KEEL Toolkit. This code was delivered as a text file and copied and pasted into a Flash application where the user interface was designed using standard Flash coding techniques. This code captured the information from scroll bars as normalized data between 0 and 100 for each of the inputs. These values were loaded into the KEEL Engine input table whenever the user makes a change to a scroll bar and the KEEL Engine is called to evaluate the data. The results collected into an accumulated value for risk and used to drive the output display.
The KEEL design can be viewed via this link to a Flash "Rendering" of the KEEL Toolkit. While this rendering is interactive, similar to what one would experience using the real KEEL Toolkit, you cannot edit the design, create the 2 and 3 dimensional graphs as shown above, animate the design with real world data or create reports or generate the KEEL Engines. But you can interact with it and trace dependencies once you become familiar with the KEEL "dynamic graphical language".
The KEEL Toolkit can also auto-generate the code so the KEEL Engine can be deployed as a standard web service. The web service has been posted on a web server that can execute web services.
You can access the web service directly by clicking on the following link: Network Threat Web Service
All of the code for this web services was auto-generated from the KEEL Toolkit design. It was then packaged using Microsoft Visual Studio 2008 as "Service.asmx" and ftp'd to the server.
Visual Studio 2008 was also used to create a client webpage to access the Network Threat Web Service.
To access the Network Threat Web Service use the following link: Network Threat Web Service Client
The client does not use any KEEL Technology. It just collects input from the user and issues a request to the web service and displays the result.
The Network Threat Web Service can be accessed by any of a number of software approaches and even be integrated into hardware devices connected to the internet.