This model describes a simple business policy that describes how an organization is to respond to changes in inventory and in the availability of trained sales personnel. For this example, the company has a product that responds to a market need. The company has decided upon an optimal market coverage with the appropriate number of trained sales personnel. If they don't have enough trained sales personnel, they will not sell enough to meet the market demand. If they have sufficient sales personnel, but are not manufacturing enough products, they cannot meet the market demand. If they make more products than required by the number of trained sales staff, they will have excess inventory. The number of trained sales staff is used to control the desired inventory (per policy). Thus if fewer than optimal number of trained sales personnel are available, then the inventory should be reduced. The way the company controls inventory is by expanding or downsizing manufacturing. In this example it is assumed that there is an optimal market coverage for an optimal number of trained sales personnel.
The KEEL DGL is used to define the functional relationships between information items.
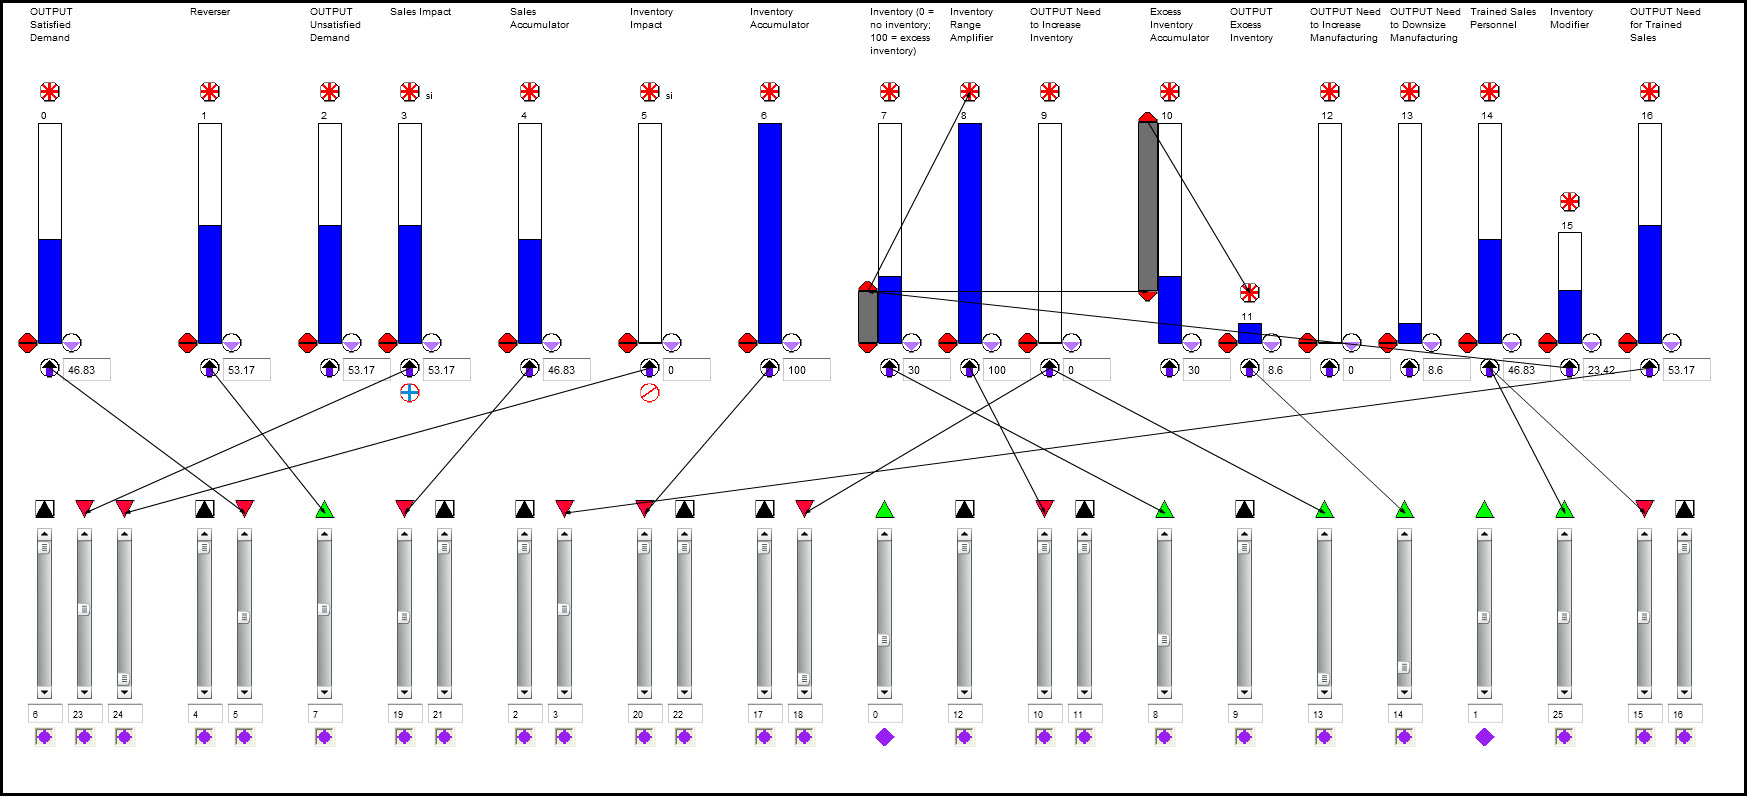
The image of the KEEL source code is shown above. This means that the above design was created using the KEEL Toolkit. The KEEL Toolkit is used to create a KEEL "engine" that process the information in the same way that it is processed in the KEEL Toolkit. The KEEL Toolkit can be used to create KEEL "engines" in C, C++, C++.NET, C#, Java, JavaScript, Octave (MATLAB), Python, Visual Basic, Visual Basic.NET, VBScript and more.
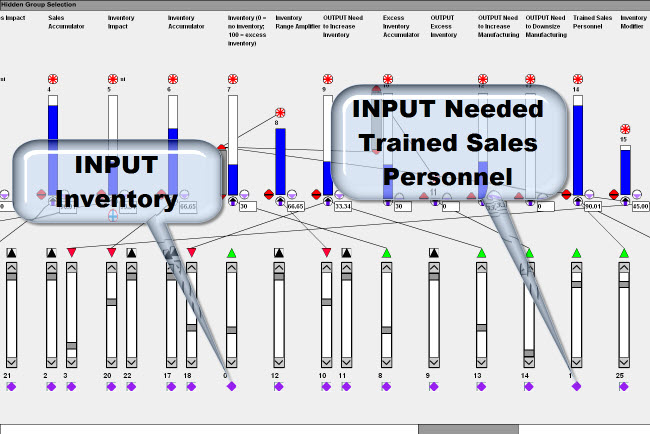
Vertical bars at the top represent outputs. The outputs can be used to control external functions or they can be used as internal information fusion points. Vertical sliders at the bottom represent inputs. Inputs can come from external sources (like Inventory and Trained Sales Personnel in this example), or they can be driven by other internal data sources. Decisions in KEEL are made by integrating driving and blocking signals. An individual (internal or external) output can be driven by any number driving or blocking inputs. Driving inputs are shown with Green triangles pointing up over the vertical sliders. Blocking inputs are shown with Red triangles pointing down over the vertical sliders.
Functional relationships are described by wires from source connection points to sink connection points. The designer things about how one data item controls the importance of another, or how one data item impacts another.
One creates the business policies by dropping outputs (called Positions in KEEL) and inputs (called Arguments in KEEL) on the screen and then using drag and drop techniques, creates the functional relationships. There is no coding of text based logic. Everything is visible on the screen.
As soon as items are dropped on the screen, a KEEL "engine" is being created behind the scenes to process the information. This allows the policy designer to interact with the design as it is being created (just as one can interact with the rendering above).
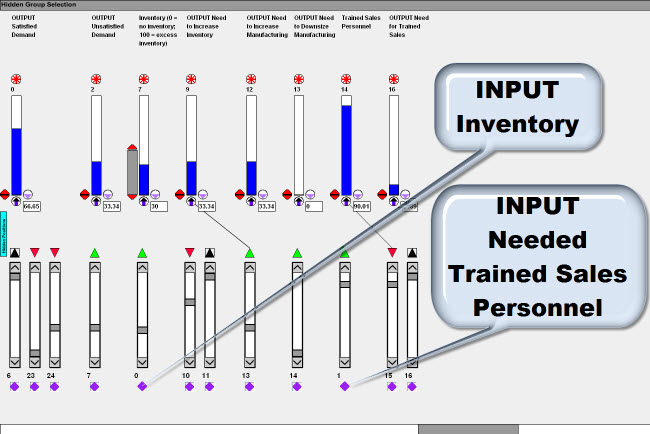
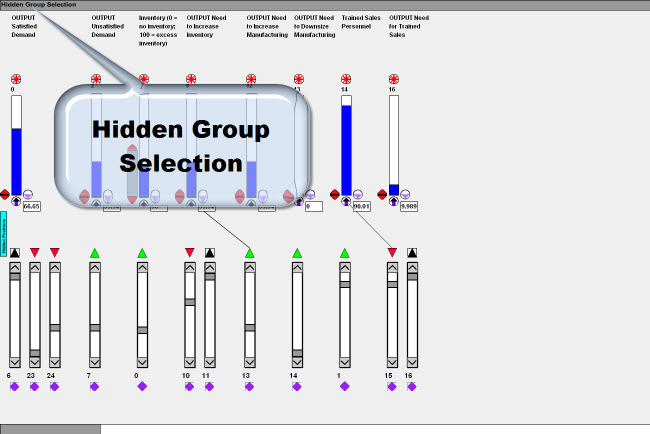
Various "views" of the model can be created. The initial view shows only the primary inputs and outputs.
You can interact with this demo by manipulating the inputs corresponding to "INPUT Inventory" (indentified as index 0) and "INPUT Needed Trained Sales Personnel" (identified as index 1).
In this model, the optimal INPUT Inventory level is 50 and the optimal INPUT Needed Trained Sales Personnel is 100. This will yield the maximum (100) for OUTPUT Satisfied Demand. (All input and output values for KEEL "engines" are normalized values between 0 and 100.)
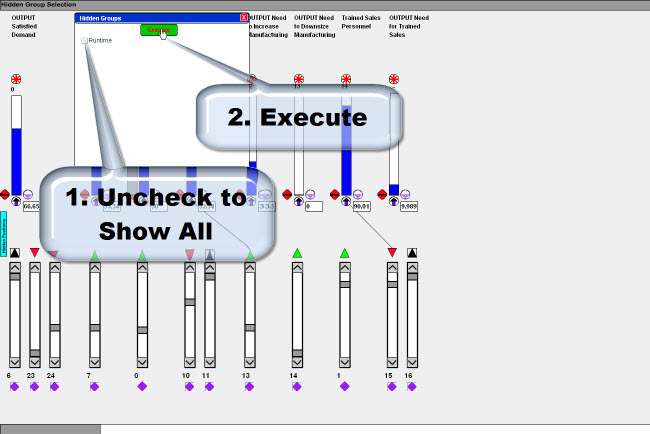
We created the "Runtime" view so you can manipulate the inputs and see the impact to the remainder of the system. In this rendering of the language we created a menu item to select other views.
The "Runtime" viwe was being displayed. Unchecking the "Runtime" view and clicking the "Execute" button shows all of the logic.
As before, you can interact with this demo by manipulating the inputs corresponding to "INPUT Inventory" (indentified as index 0 about half way across the screen) and "INPUT Needed Trained Sales Personnel" (identified as index 1 - fourth input from the right).
You can trace the wires to see how information items interact. Click on different components to get additional information. Once you have been trained to read and interact with this language it is easy to understand how information items are valued and how they interact.
It is highly unlikely that any business would want to publish the KEEL source code on their website as we are doing here.
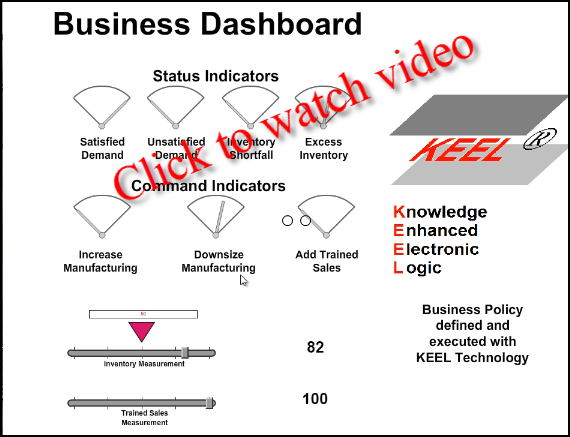
It is more likely that KEEL "engines" would operate behind the scenes and signal certain actions via messaging or other techniques that an organization might employ to control their organizations. The KEEL "engines" could also be integrated into business dashboards as we are showing below. The same KEEL "engine" that controls the rendering of the "language" above is used to control the dashboard below. The technology behind the GUI for the dashboards is available from many sources. The KEEL Technology to address the complex business logic is available only from Compsim.
Like the rendering of the KEEL policy above, this dashboard is interactive. The two sliders allow you to simulate changes in inventory and in the number of available trained sales personnel. These sliders control the same inputs as in the language rendering. The results are displayed in either "status" indicators or "command" indicators.
For more information on the KEEL and the DGL see:
|
Copyright , Compsim LLC, All rights reserved |