See other behavioral demonstrations: Embedded Reasoning
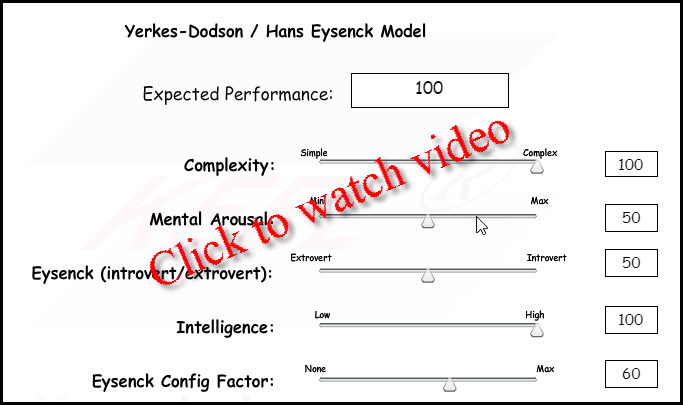
KEEL was developed to package human judgment and reasoning for embedded applications. These activities are complex (dynamic, non-linear, inter-related, and multi-dimensional). The KEEL Dynamic Graphical Language is particularly well suited for capturing, testing, packaging, auditing, and explaining models with these characteristics. Human behavior is the result of interpreting numerous factors that drive the behavior. The Yerkes-Dodson / Hans Eysenck models depicted in this demonstration show how information is interpreted and how factors cause the curves (non-linear relationships) to be stimulated as the input factors change. Once the models are created, they are well suited for embedding in broader real-time applications where the models of human behavior can be used to predict future events.
From Wikipedia, the free encyclopedia: Yerkes-Dodson
"Yerkes-Dodson law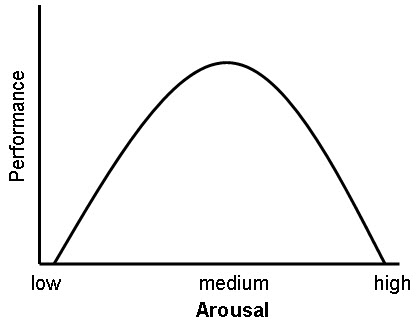 The Yerkes-Dodson Law is an empirical relationship between arousal and performance, originally developed by psychologists, Robert M. Yerkes and J. D. Dodson in 1908.[1] The law dictates that performance increases with physiological or mental arousal, but only up to a point. When levels of arousal become too high, performance decreases. The process is often illustrated graphically as a curvilinear, inverted U-shaped curve which increases and then decreases with higher levels of arousal. Research has found that different tasks require different levels of arousal for optimal performance. For example, difficult or intellectually demanding tasks may require a lower level of arousal (to facilitate concentration), whereas tasks demanding stamina or persistence may be performed better with higher levels of arousal (to increase motivation). Because of task differences, the shape of the curve can be highly variable. For simple or well learned tasks, the relationship can be considered linear with improvements in performance as arousal increases. For complex, unfamiliar, or difficult tasks, the relationship between arousal and performance becomes inverted, with declines in performance as arousal increases." |
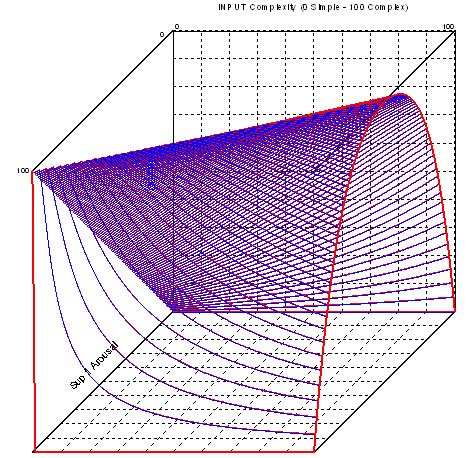
Our interpretation of the above sentence modeled in KEEL shows the shape of the curve changing from linear (simple) to bell (complex).
When we discussed Yerkes-Dodson with Dr. Dave Osmon (a neuropsychologist at UWM), he suggested we look into the work of Hans Eysenck relative to how introverts and extroverts might impact the model.
From Wikipedia, the free encyclopedia: Hans Eysenck
| "The major strength of Eysenck's model was to provide detailed theory of the causes of personality. For example, Eysenck proposed that extraversion was caused by variability in cortical arousal: "introverts are characterized by higher levels of activity than extraverts and so are chronically more cortically aroused than extraverts".[3] While it seems counterintuitive to suppose that introverts are more aroused than extraverts, the putative effect this has on behaviour is such that the introvert seeks lower levels of stimulation. Conversely, the extravert seeks to heighten his or her arousal to a more optimal level (as predicted by the Yerkes-Dodson Law) by increased activity, social engagement and other stimulation-seeking behaviors." |
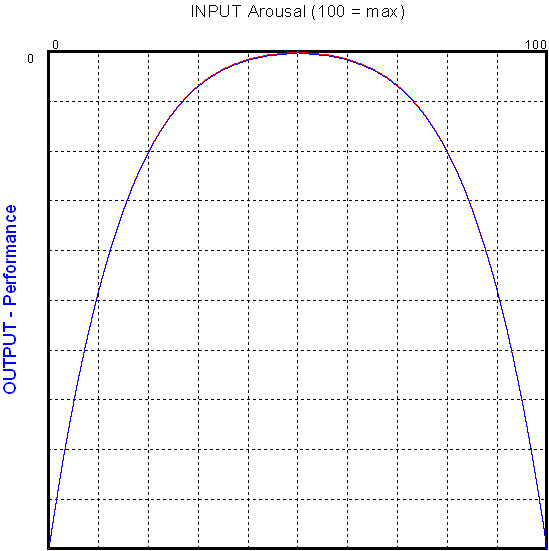
We took the bell shaped curve for complex models and "bent" it for introversion and extroversion.
First the normal curve:
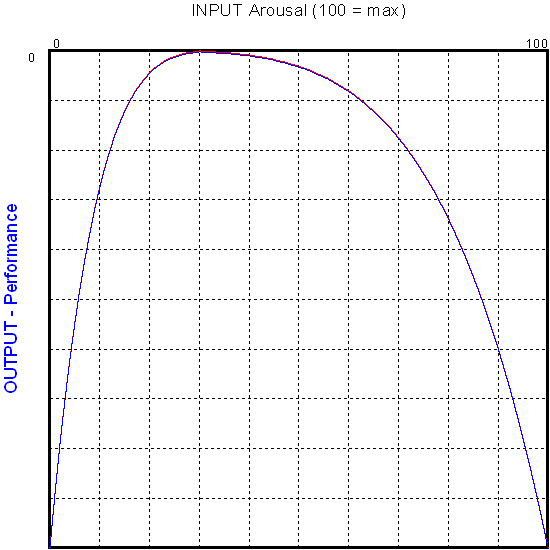
Now the curve shifted to the left for an introvert that needs less arousal to obtain maximum performance.
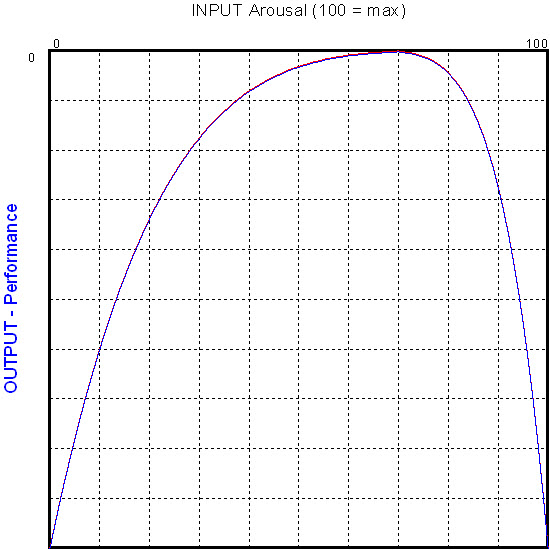
Now the curve shifted to the right for an extrovert that needs more arousal to obtain maximum performance.
When we created the KEEL "engine" for this "Yerkes-Dodson" / "Eysenck" model we (with full lack of knowledge) decided how much the introvert / extrovert shift could be. We added a tuning adjustment so the shift could be more or less. The graphs above show a configuration value of 60.
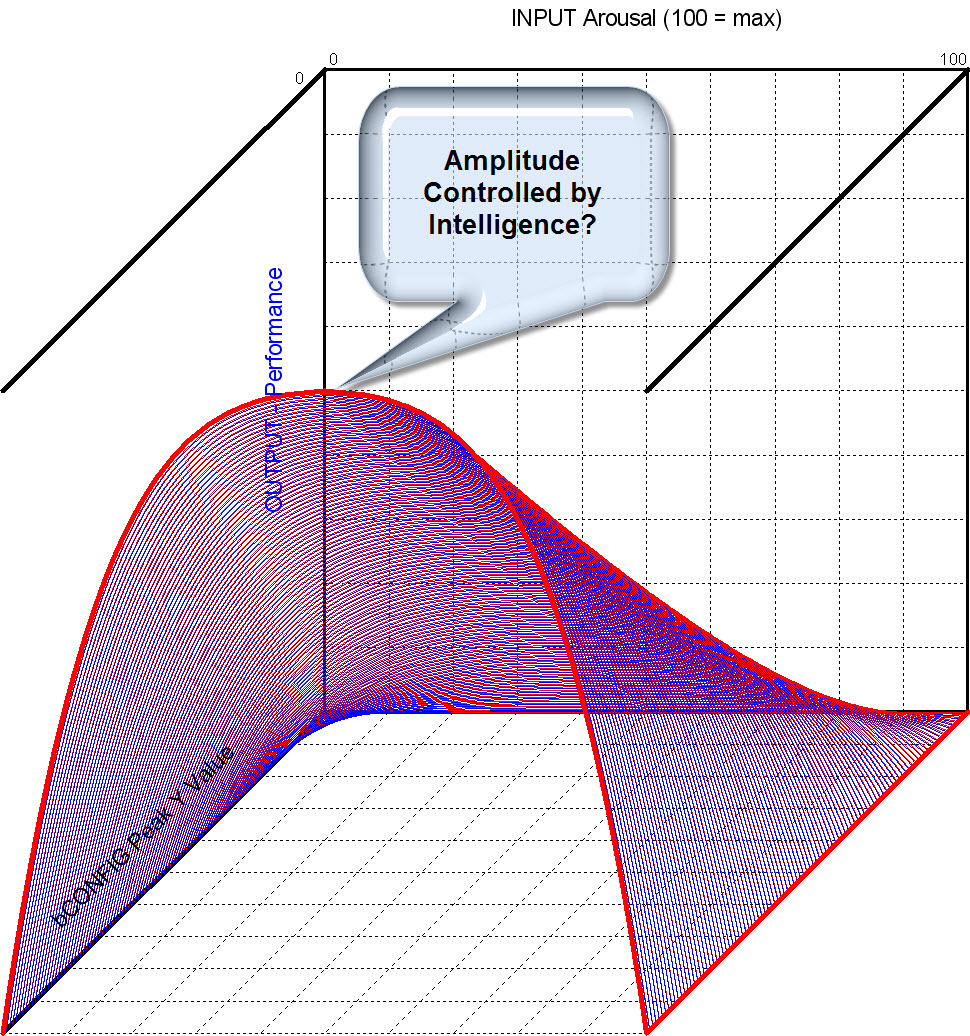
While we don't know if the level of performance might be shifted up and down based on Intelligence, we thought it might be an interesting addition. Since this configuration setting was already built into the KEEL bell shaped curve imported into the design, we left it exposed.
With KEEL, all variables (the inputs) are processed together, so one can feed it: "
And obtain the suggested level of performance (the output).
This is a demonstration of KEEL's capability and not any kind of suggestion about the relative merits of Yerkes-Dodson, Eysenck, or even the self assigned impact of intelligence.
Background Documentation in pdf form
|
Copyright , Compsim LLC, All rights reserved |